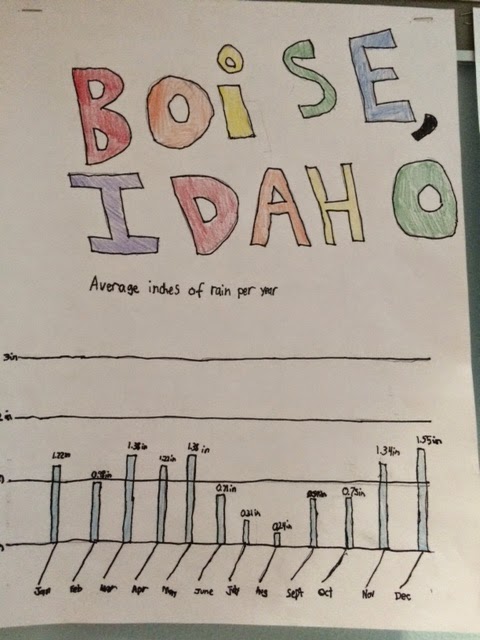
Students worked in pairs to create bar graphs showing the average inches of precipitation in their selected cities each month.
Subscribe to:
Post Comments (Atom)
About Me

- Mrs. Maxwell's Fifth Grade Class
- I live in Cape Elizabeth with my husband, two daughters, and our cat Nessie. Our family loves to spend time outdoors together, camping, hiking, and gardening. Another past time of mine is triathlons. I have completed nine triathlons, including one Half Ironman. I loved swimming, biking, and running 70.3 miles! You might also find me cozied up with a good book in my free time. I have been teaching for 10 years in a variety of grade levels. Fifth grade is my favorite! The kids are capable of so much! I can't say I have a favorite subject to teach, but love getting students to think deeply. I enjoy getting kids to think critically and be creative in all subject areas. I often use simulations and project based learning to do this. Teambuilding and working on social skills in another major goal of mine. Teaching kids to work effectively together and use good communication skills will help prepare them for life after school.


No comments:
Post a Comment